Today we’re diving into the Medicare Payment Advisory Commission’s (MedPAC) March report to Congress. As you can imagine, the report itself is riveting, so I’ve taken the liberty of reading it and distilling down some of the more interesting points for you. Really though, if you want a good overview of trends and spending in healthcare, it’s a solid place to start!
Announcing the Launch of the Hospitalogy Community! The Board Room
I’m excited to officially announce the launch of the Hospitalogy community!

If you’re reading this, you know Hospitalogy’s mission is to bring you insightful, digestible, and real time information about our complex healthcare ecosystem.
Over the last few years, I have had the pleasure of having conversations with hundreds of you in my inbox, virtually, and live where you have asked inquisitive questions, expanded my perspective, and introduced me to your peers. Whether I realized it or not, a strong network of Executives was coming together.
Today, I’m elated to extend the invite for all the Healthcare Executives in the Hospitalogy orbit to join in on the conversation via my new community: the Board Room. You can learn more here, but the community experience boils down to:
- Invitations to bi-annual in person meetups across the country
- Early access to quarterly market trends reports and full access to the data books, graphics, and analysis that I put together with it
- Executive Briefings with the group on key, real-time healthcare topics each month
- and an opportunity to expand your rolodex via 1-1 introductions I personally make between Executives in the community every two weeks.
If you’re a decision maker or Executive in Healthcare, I think you’ll find being an early member of this community valuable. Content is powerful, but digesting + debriefing that content with peers at your level, across industries is what moves this industry forward.
Membership dues help us maintain a high-quality experience for you. I was able to swing 30% off annual dues for any Healthcare Executive who joins by April 1st. Use FOUNDING30 at checkout and we’ll add you to the conversation.
MedPAC’s 2023 Report: Key Takeaways
Link to the Full MedPAC March 2023 Report to Congress.
MedPAC’s overall tone for Medicare tends to be something along these lines: “We need to rein in spending to keep Medicare solvent. Current spending trends along with demographic trends sets up Medicare for insolvency in 5 years. So, let’s constrain fee-for-service prices as much as possible while keeping providers afloat. This price control will incentivize providers to manage cost inputs and push them into alternative payment models or other reforms.”

This dynamic stinks for providers – if you’re not a powerful lobby like the AHA, providers are often fighting an uphill battle for reimbursement. You can pretty easily see this in public discourse as physicians often bemoan professional reimbursement cuts, and services verticals like home health have faced cuts over the past few years. Declining FFS payments in large part have resulted in consolidation in healthcare, which is counterproductive to MedPAC goals considering consolidation has a direct relationship with higher prices in healthcare.
MedPAC’s also a fan of price setting, something that is wildly unpopular among certain politicians, but there is now some precedent in limited form through the Inflation Reduction Act. Price setting in Medicare would create ripple effects in healthcare considering that many private commercial rates are based on a percentage of Medicare, known as reference pricing.
The MedPAC thinking lines up with CMS’ overarching goals of having EVERY Medicare member in an accountable care arrangement that focuses on quality and lowering total cost of care (e.g., the ‘ole FFS vs. Value-based Care debate) by 2030. As costs grow unsustainable, government programs will continue to drive healthcare away from fee-for-service payments.
As I’ve written before, these trends are why enablement players in particular interest me. Payment policies for the foreseeable future will incentivize and support players working in and around risk and Medicare Advantage. Investment activity and strategic players are flooding the value-based care space. Medicare projected spending trend is exactly why you’re seeing players like Aledade, ApolloMed, and Agilon outperform while also scooping up assets in predictive analytics and data (Curia, Orma Health, and mprhX, respectively). Given that specialty care is such a large proportion of total cost of care, expect to see plenty of activity here as well.
Finally, as capital markets allow, we’ll continue to see consolidation in fee-for-service land as providers merge to save on costs and boost commercial rates.
Background and Context for MedPAC’s Report
Every March, MedPAC (the Medicare Payment Advisory Commission) releases its analysis of healthcare fee-for-service (FFS) payments across most services verticals along with updates on other initiatives Congress has tasked it with handling.
MedPAC then determines whether Medicare fee-for-service payments are adequate for each vertical and makes a payment recommendation to Congress, which is taken into consideration when setting future Medicare payments. In essence, MedPAC wants to find the optimal payment update to the point where providers keep the lights on, but no excess. Keep that in mind to put the Commission’s recommendations in context.
Join the thousands of healthcare professionals who read Hospitalogy
Subscribe to get expert analysis on healthcare M&A, strategy, finance, and markets.
No spam. Unsubscribe any time.
Here’s the MedPAC framework for determining whether payments are keeping up. You can read through this starting on page 70 of the report:

MedPAC bases this payment recommendation on Medicare beneficiaries’ ability to access care, quality of care they receive, total supply of facilities and providers, provider access to capital, and provider costs.
In this deep dive, I’ll be covering MedPAC’s broader executive summary, hospital, physician, and payor dynamics, and my thoughts on these topics.
1. A summary of MedPAC’s recommendations
Here’s a quick overview of what MedPAC has recommended for 2024 payment updates from CMS:
Hospitals: Increase base payments by current law statutes plus 1% – landing inpatient care (IPPS) and outpatient care (OPPS) payments around 3% in 2024. This is in-line with most analyst commentary and hospital expectations, although they’ll always clamor for more.
- MedPAC also acknowledged that this update wouldn’t be enough to keep Medicare safety net hospitals afloat. To that end, it advised changes to how disproportionate share (DSH) and uncompensated care payments are distributed.
Physicians: Increase physician payments by 50% of the Medicare Economic Index, or about 1.45% based on the most recent estimate. Boost payments for safety net PCPs.
Dialysis: Increase the base rate by the amount specified by current law – 1.8%
SNF: Reduce base payments by 3% in 2024.
Home Health: Reduce base payments by 7% (!!) in 2024.
Inpatient Rehab: Reduce base payments by 3% in 2024.
Hospice: Reduce reimbursement for hospice providers with disproportionately long stays and high margins. Overall, increase payments for most hospice providers by 2.9%.
Blake’s Takeaway: MedPAC’s report this year focused a lot more on inflationary concerns and variation in cost inputs, even noting that 2022 input costs for hospitals were highly variable.
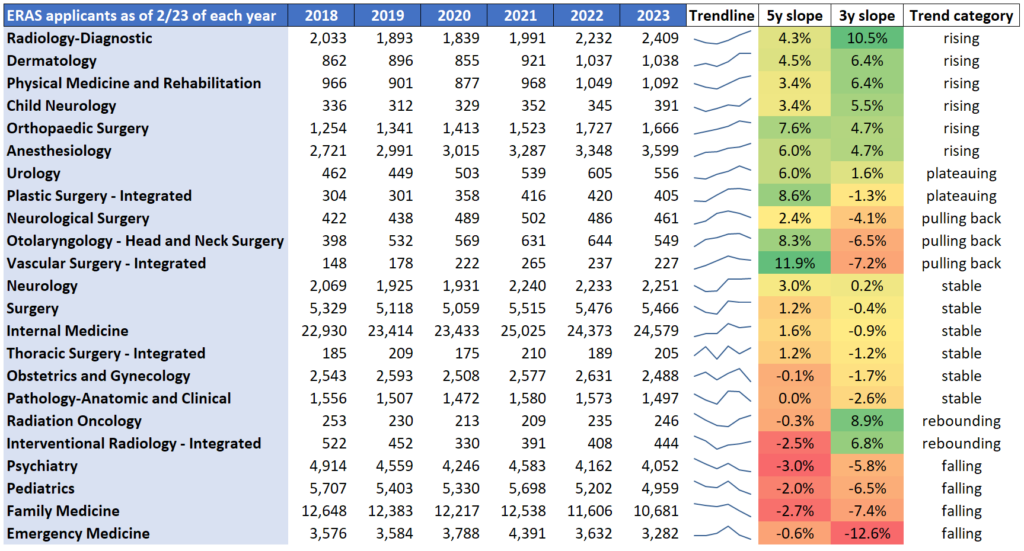
2. Rapid Rise in mid-levels coincides with lower primary care physicians, Residency trends
Credit: Francis Deng, MD
Context: “The supply of most types of clinicians has been growing in recent years, although the composition of the clinician workforce continues to change, with a rapid increase in the number of advanced practice registered nurses and physician assistants, steady increase in the number of specialists, and a slow decline in the number of primary care physicians. These changes have coincided with our annual survey finding that both Medicare beneficiaries and privately insured people report more problems obtaining a new primary care provider than a new specialist.”
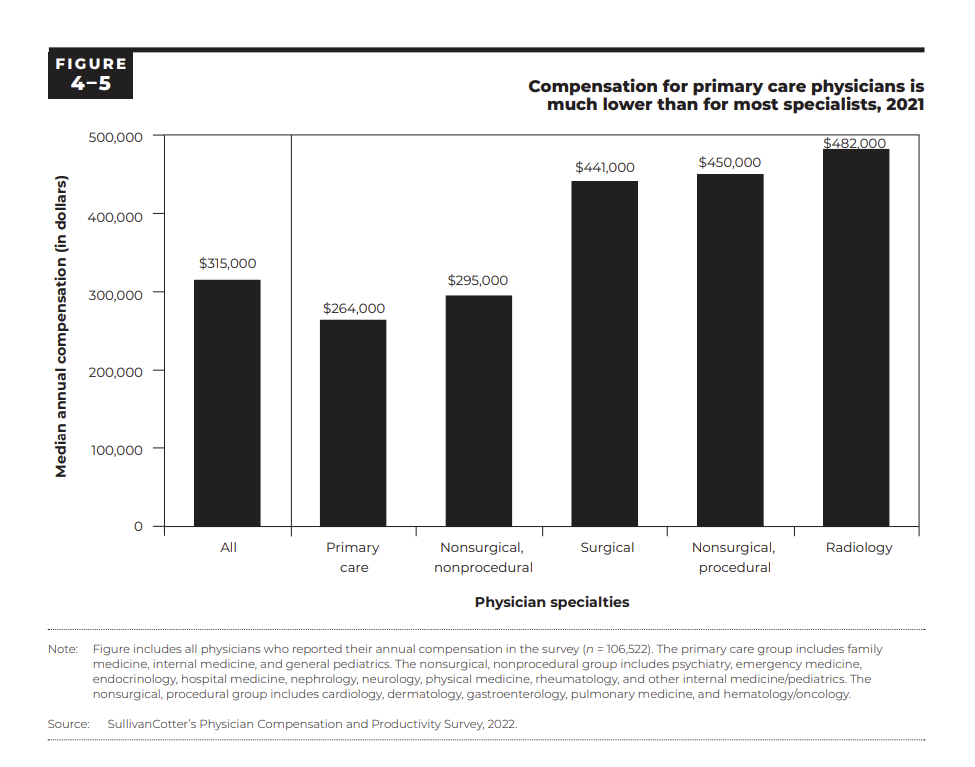
“Between 2017 and 2021, physicians’ median all-payer compensation grew by an average of 3 percent per year. However, compensation remained much lower for primary care physicians than for most specialists—underscoring our long- standing concerns about the mispricing of physician fee schedule services and its impact on the number of physicians choosing to practice primary care.”
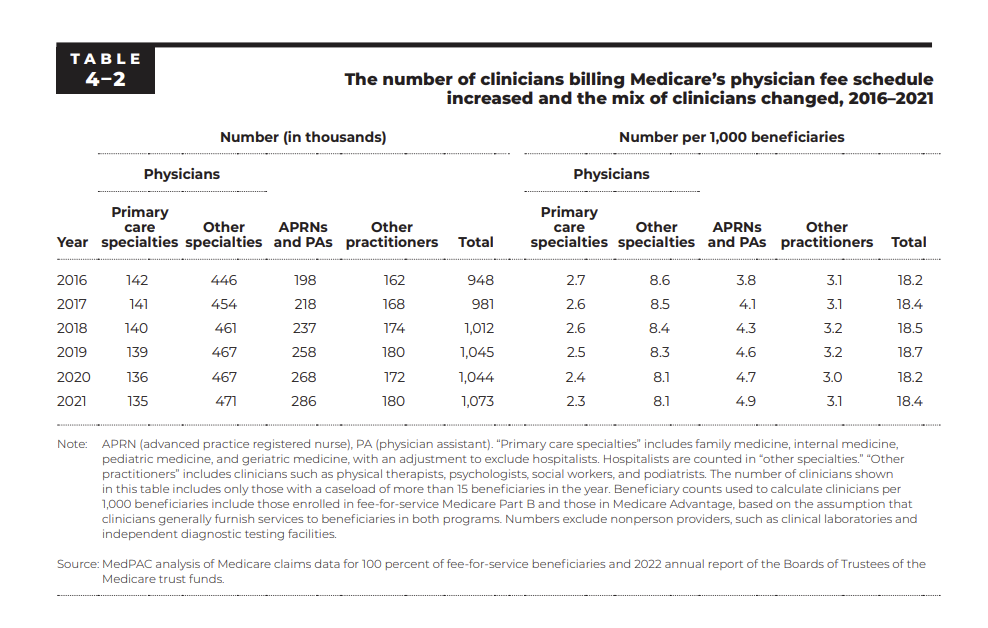
Blake’s Takeaway: It’s pretty interesting how perfectly these dynamics line up with the recent residency trends. All primary care related residency slots are trending lower while mid-level providers (APPs) skyrocket. The signal is clear: APPs are encroaching on primary care physician territory as economics favor APPs in business models (APPs cost half as much). Couple this with the fact that being a specialist versus a PCP gives a physician much more status and compensation to boot, and you kind of have a perfect storm of events here. The drop in future PCPs, if sustained, has implications on patient care as indicated by a recent study, value-based care models, and overall utilization. MedPAC states later on in the report that recent 2021 changes to E&M codes should reduce the income gap a bit between specialists and primary care providers
3. MedPAC had words for Medicare Advantage
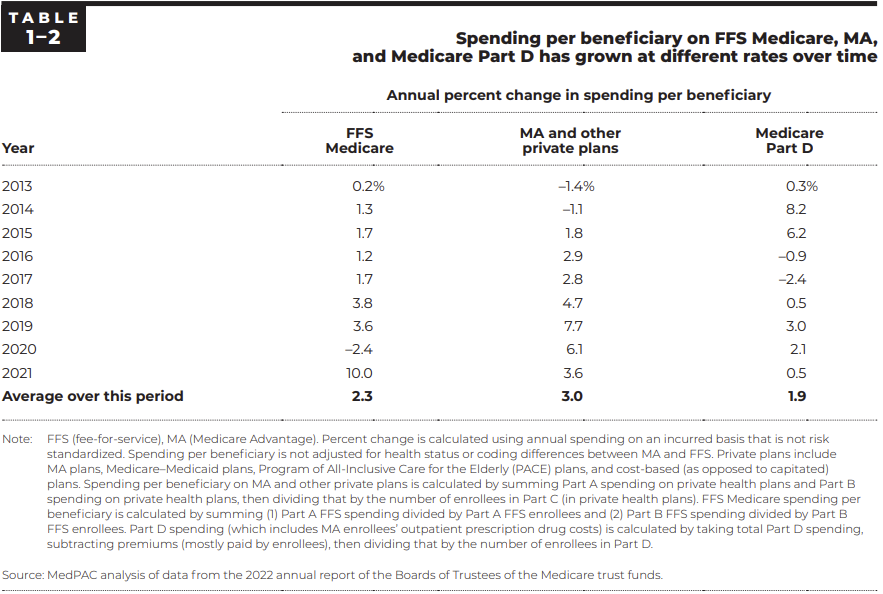
Context: “The Commission remains concerned that the benefits from MA’s lower cost relative to FFS spending are shared exclusively by the companies sponsoring MA plans (in the form of increased enrollment and revenues) and MA enrollees (in extra benefits). The taxpayers and FFS Medicare beneficiaries who help fund the MA program through Part B premiums do not realize any savings from MA plan efficiencies.”
“The current state of quality reporting in MA is such that the Commission can no longer provide an accurate description of MA quality of care.” – this is nuts lol
Blake’s Takeaway: MedPAC had a LOT to say about Medicare Advantage (MA) and pushes some buttons with this one on an annual basis. Its findings show that while the average Medicare Advantage (MA) bid is 17% lower than comparable traditional Medicare benefits, those savings are eaten up by MA supplemental benefits and shareholder returns. Overall, MedPAC reports that MA spends 6% more than Medicare – which it estimates is an excess of $27 billion. MedPAC also takes issue with the lack of oversight on supplemental benefits and, of course, coding practices. We should expect to see more scrutiny in both areas if recent RADV activity is any indication. Seniors also deserve greater transparency and better data when comparing Medicare and MA.
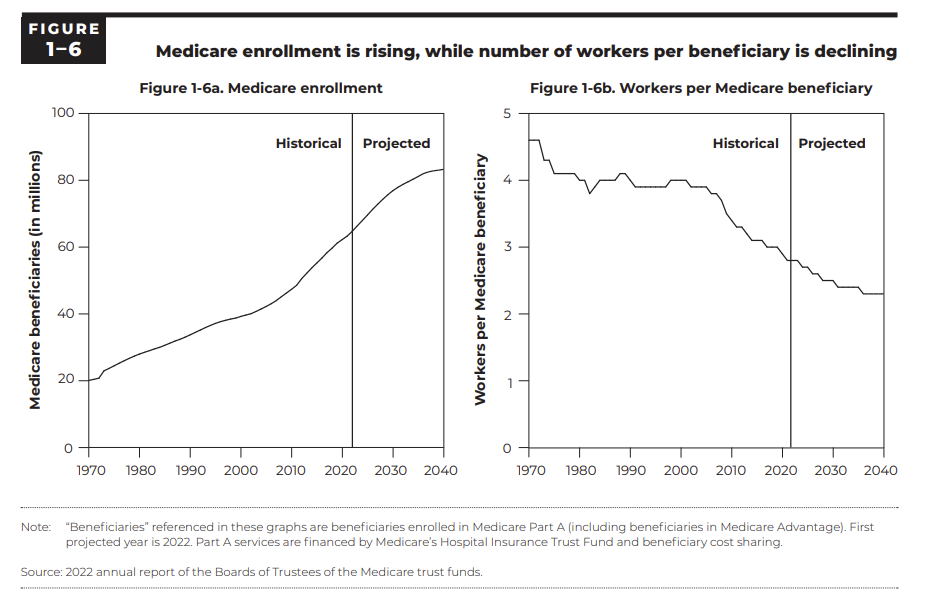
Medicare Advantage is currently the pot of gold for insurers, and for now, the money is flowing – for both the benefit of seniors and shareholders. Taxpayers, not so much. This is probably fine until 1.8 trillion folks are on Medicare and a shrinking healthy population is footing the bill.
This trend is not sustainable and eventually the good ole Millennials are gonna be footing a hefty bill:
4. Increased volatility and variability in hospital performance
Variable input costs across hospitals: “As described in Chapter 3, in 2021, most indicators of hospital payment adequacy remained positive or improved. However, indicators continued to vary substantially across hospitals, and some indicators remained below prepandemic levels. In 2022, input cost increases for hospitals were higher and more volatile than they have been in recent years.”
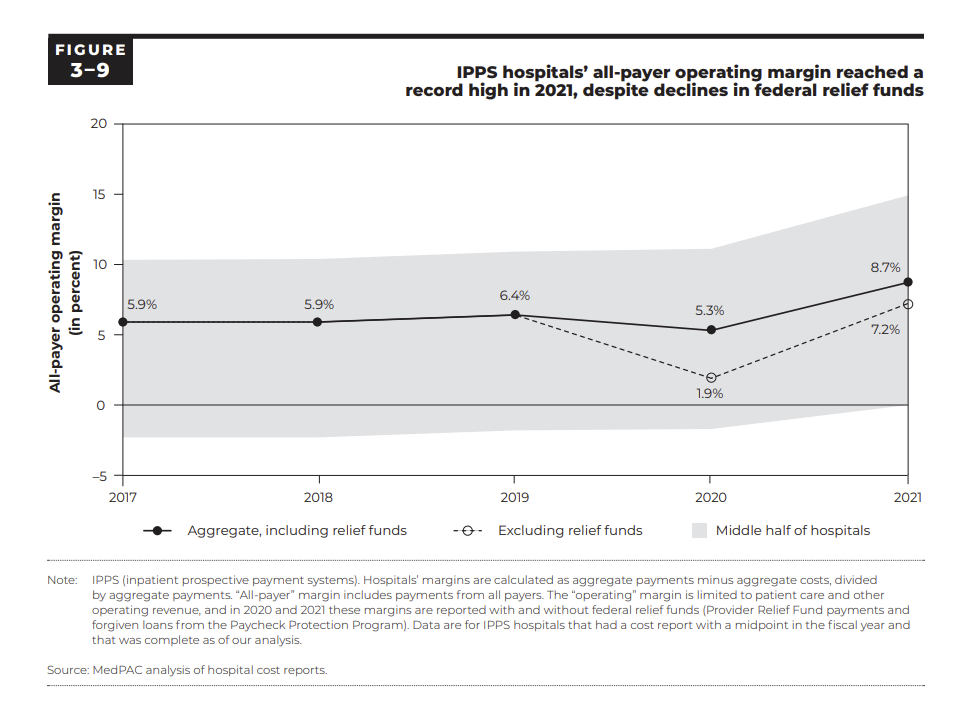
MedPAC noted strong hospital margins in 2021: “In 2021—the most recent year of data for most of our measures—most hospital payment adequacy indicators remained positive or improved, despite the continued coronavirus pandemic. In particular, the number of general ACHs that closed was the same as the number that opened; IPPS hospitals’ all-payer operating margin increased to a record high of 8.7 percent; and the median Medicare margin for relatively efficient hospitals increased to near break-even, exclusive of Medicare’s share of federal relief funds, and remained at 1 percent when including these funds…For 2023 we project IPPS hospitals’ Medicare margin will decrease to about -10% (similar to the level in 2017) and the median Medicare margin for relatively efficient hospitals will decline to modestly below break-even, similar to prepandemic levels.”
On variation in hospital margins: “Within hospitals’ aggregate all-payer operating margin, there continued to be significant variation: The 2021 operating margin ranged from 0.8 percent to 14.9 percent among the middle half of IPPS hospitals.”
On preliminary 2022 hospital margins: Because 2021 was atypical, we also compare these large systems’ 2022 all-payer margins with their prepandemic (2019) operating margins. Our sample of partial year data for 2022 is limited to five large systems that represent about 17 percent of all IPPS hospitals. From the fiscal year ending in June 2019 to the fiscal year ending in June 2022, two of the largest nonprofit systems reported a decline in operating margins of 2 percentage points to 4 percentage points (Ascension 2022a, Ascension 2020, Trinity Health 2022a, Trinity Health 2020). In contrast, during the first nine months of 2022 compared with the first nine months of 2019, two of the three largest for-profit systems reported an increase in operating margins of 2 percentage points to 4 percentage points (HCA Healthcare 2022, HCA Healthcare 2020, Tenet Health 2022, Tenet Health 2020); the third reported a 2022 operating margin similar to its 2019 margin (Community Health Systems 2022, Community Health Systems 2020). Aggregating the data from these five systems, all-payer operating margins remained positive and about equal to 2019 levels.17 There is still a material level of uncertainty regarding labor costs and overall profitability in the fourth quarter of 2022.
Blake’s Takeaway: MedPAC’s analysis confirms that pandemic relief funds bolstered hospital financial performance in 2021. When looking at 2022 preliminary margins, MedPAC seems to cherry pick HCA, Tenet, CHS, Ascension, and Trinity to confirm for itself that ‘hospitals are fine’ when many industry publications are stating the opposite. How this reconciles, I truly have no idea, but you should know that there is confirmation bias with data on both sides (in my humble opinion).
5. Patients still like hospitals, but experience declined during pandemic
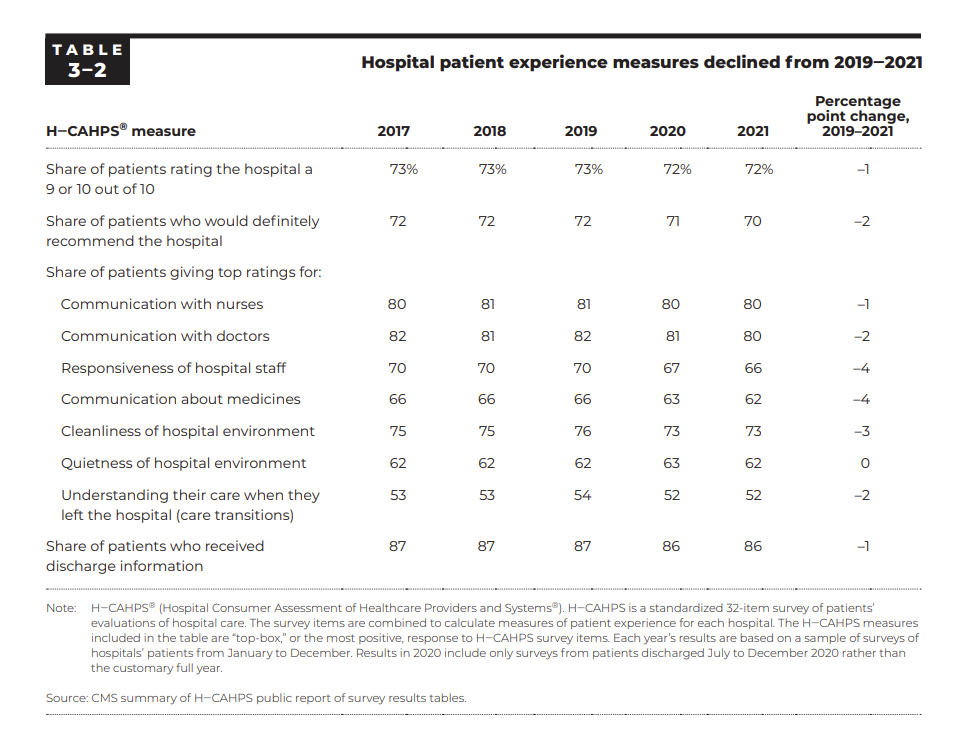
Blake’s Take: While patient experience measures dropped a bit from 2017 – 2021, I’d wager that most of the change is from the pandemic and labor challenges rather than any big shifts in hospitals themselves. The fact of the matter is that patients still have good experiences in hospitals, which gives hospitals a distinct brand advantage for care in local communities. Of course, there’s always the question of whether the patient experience should be HIGHER than what’s shown here. One notable tidbit – patients still have a lack of understanding for their diagnosis post-discharge and transitions in care is an area that needs major improvement, especially as length of stay in hospital creeps up.
That’s it for this week! Join 20,000+ executives and investors from leading healthcare organizations including VillageMD, Privia, and HCA Healthcare, health systems including Providence, Ascension, and Atrium, as well as leading digital health firms like Cityblock, Oak Street Health, and Turquoise Health by subscribing here!
