Hospitalogy

🏥 UnitedHealth Group's Q2 in 4 Charts

Blake Madden · JUL 18

Happy Thursday, Hospitalogists!


Today's is a quick scan of UnitedHealth Group's Q2 with some notes and analysis below. Main takeaways here being that we seemed to have reached peak bearishness for most names in managed care, and the market seems to be leveling off pending anything catastrophic.


I hope you enjoy the visuals - feel free to use them, but please cite Hospitalogy if you do.

UnitedHealth Group Q2 Visualized


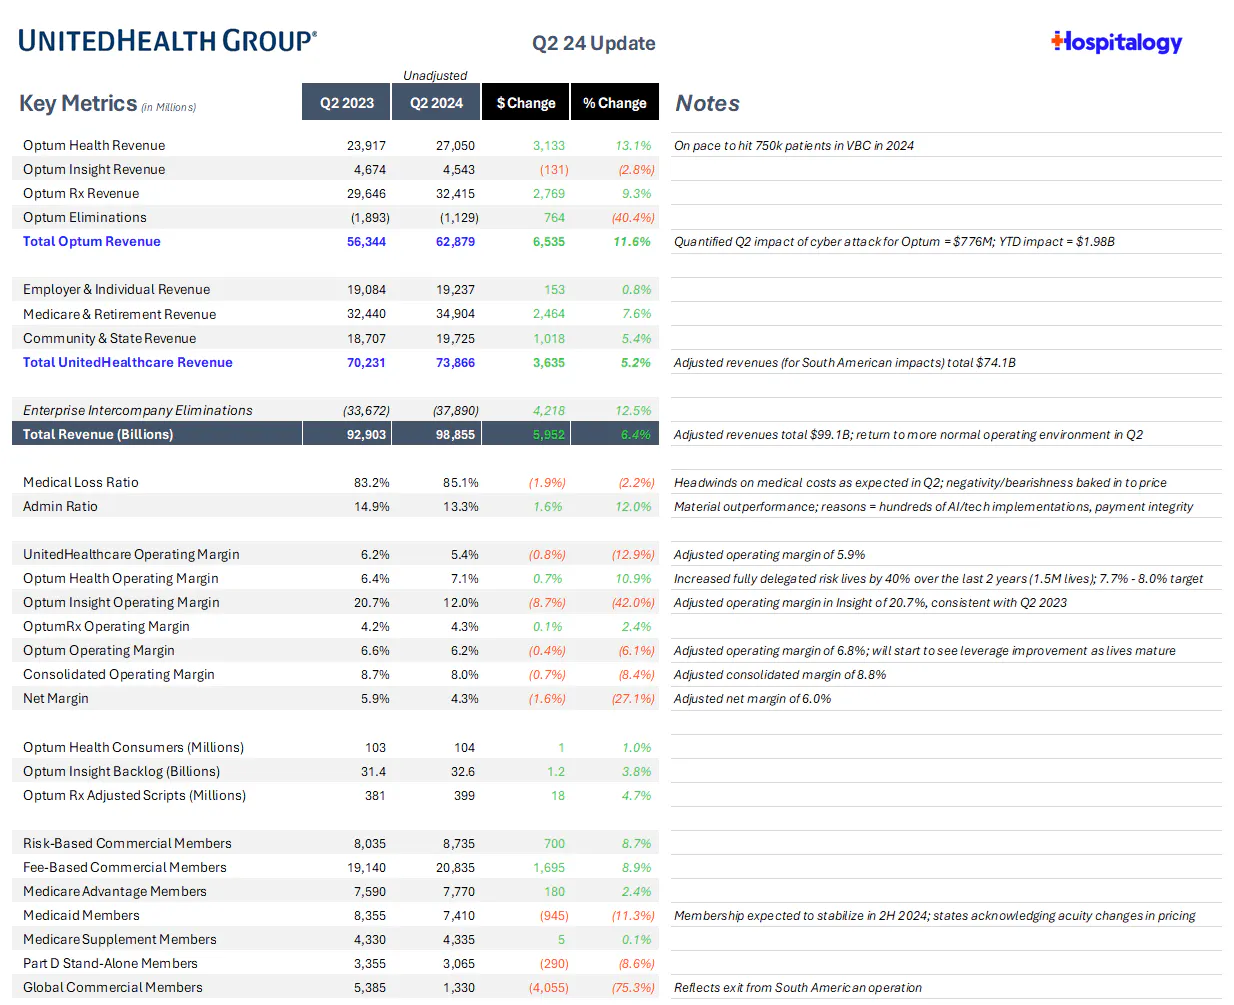
My executive summary for UnitedHealth Group performance in Q2:

  • Strong commercial growth stemming from its Surest plans
  • Significant operating leverage stemming from AI, tech implementations
  • Note that the figures in the Q2 2024 column are unadjusted


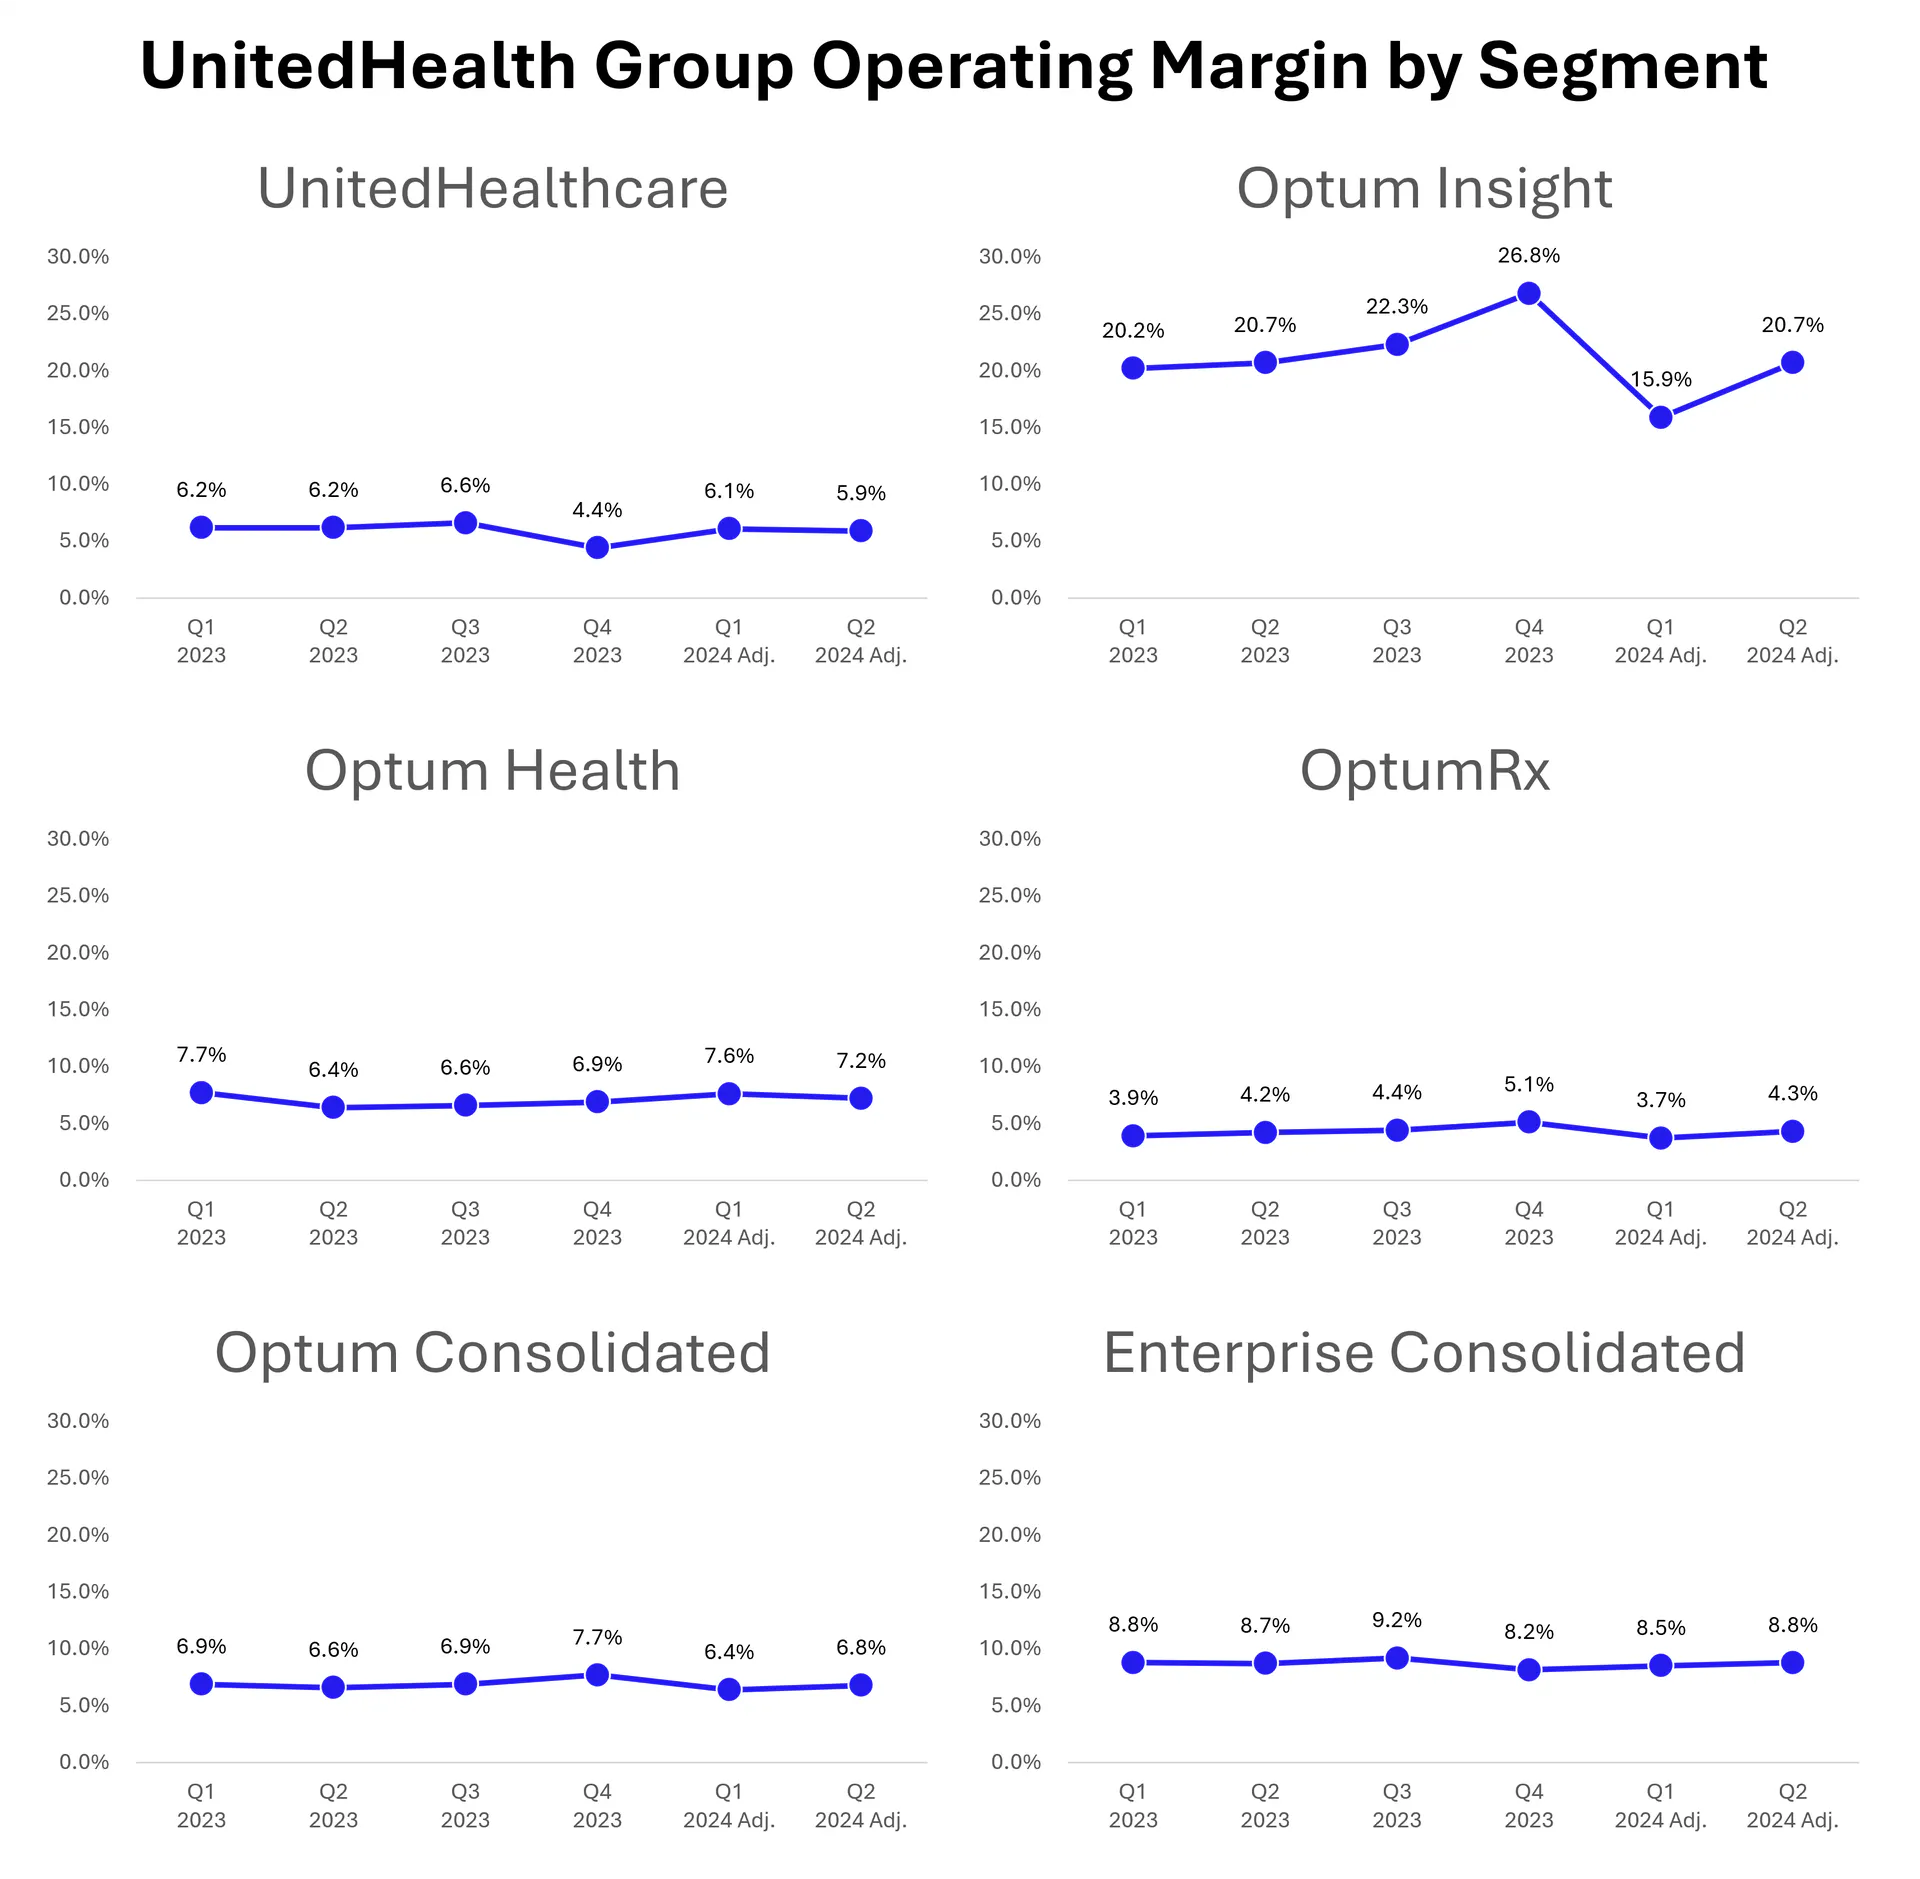
Operating Margin by segment, sequentially:

  • For sake of comparability, I'm using UnitedHealth Group's provided adjusted figures below:


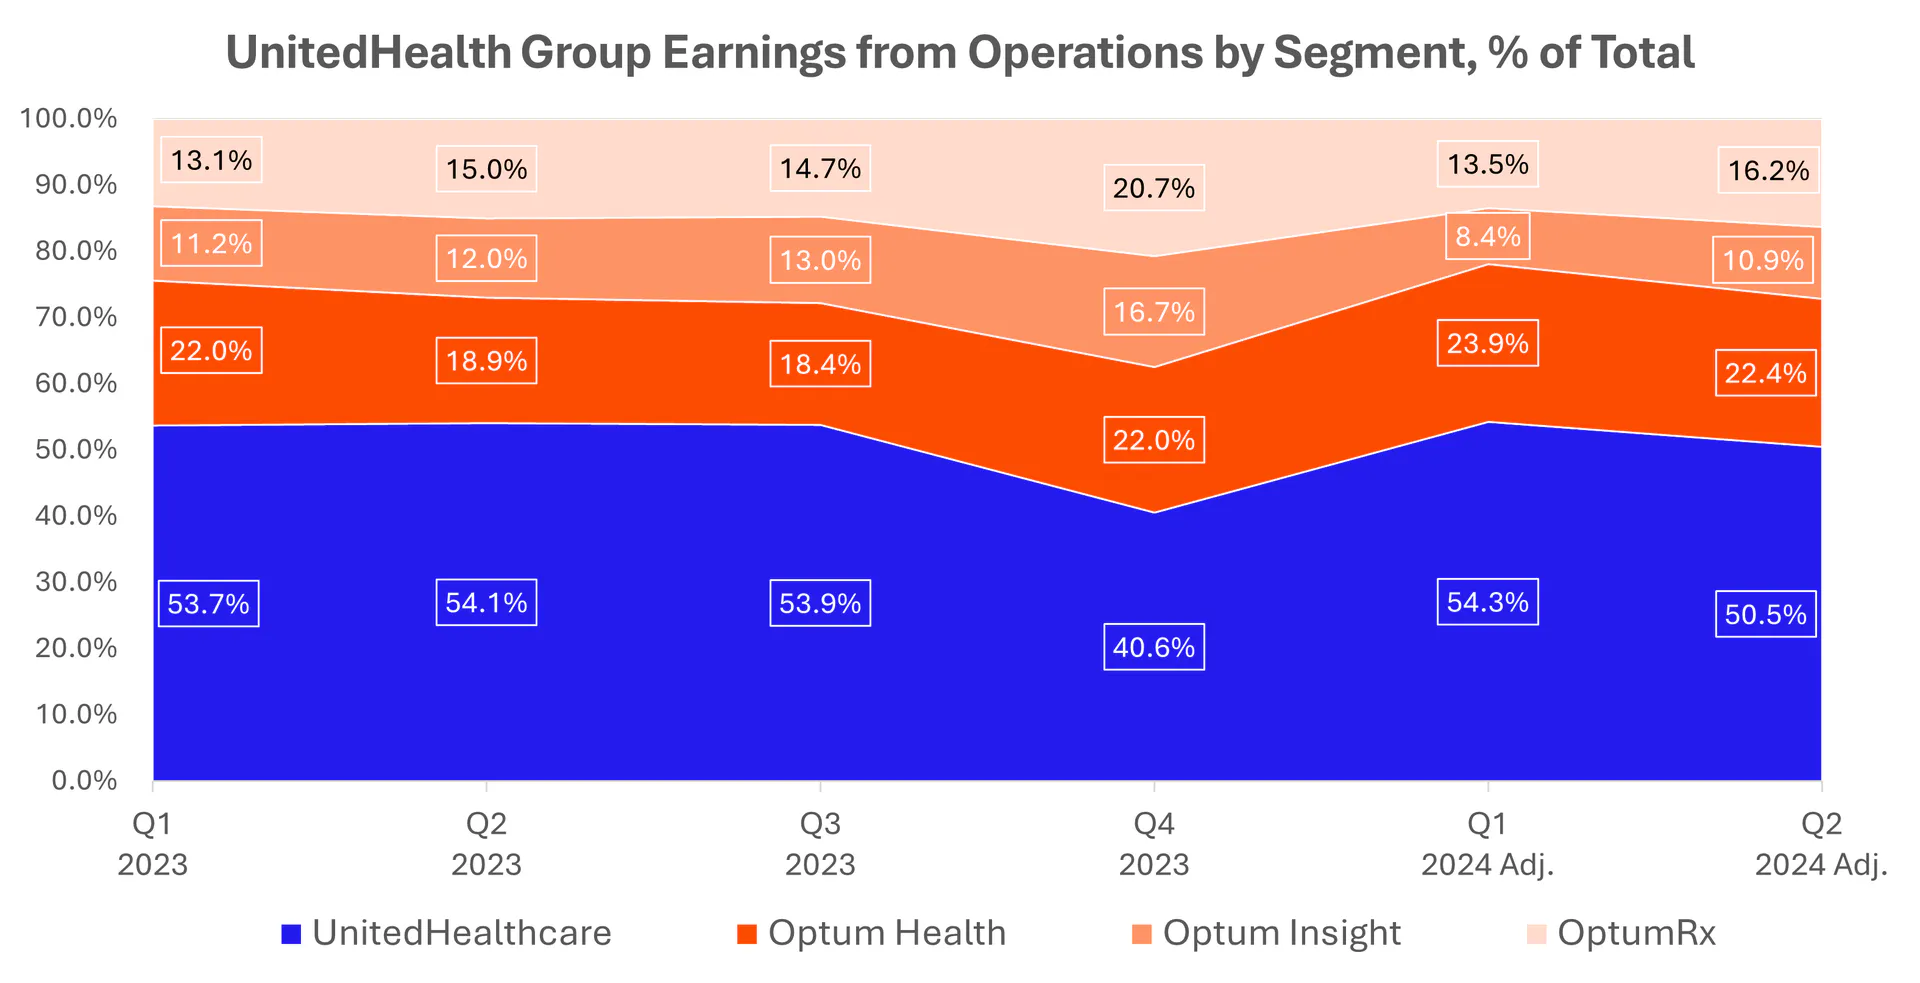
Earnings from Operations as a % of Total, Sequentially:

  • Optum is still hovering at around 50% of total operating income enterprise-wide in Q2:


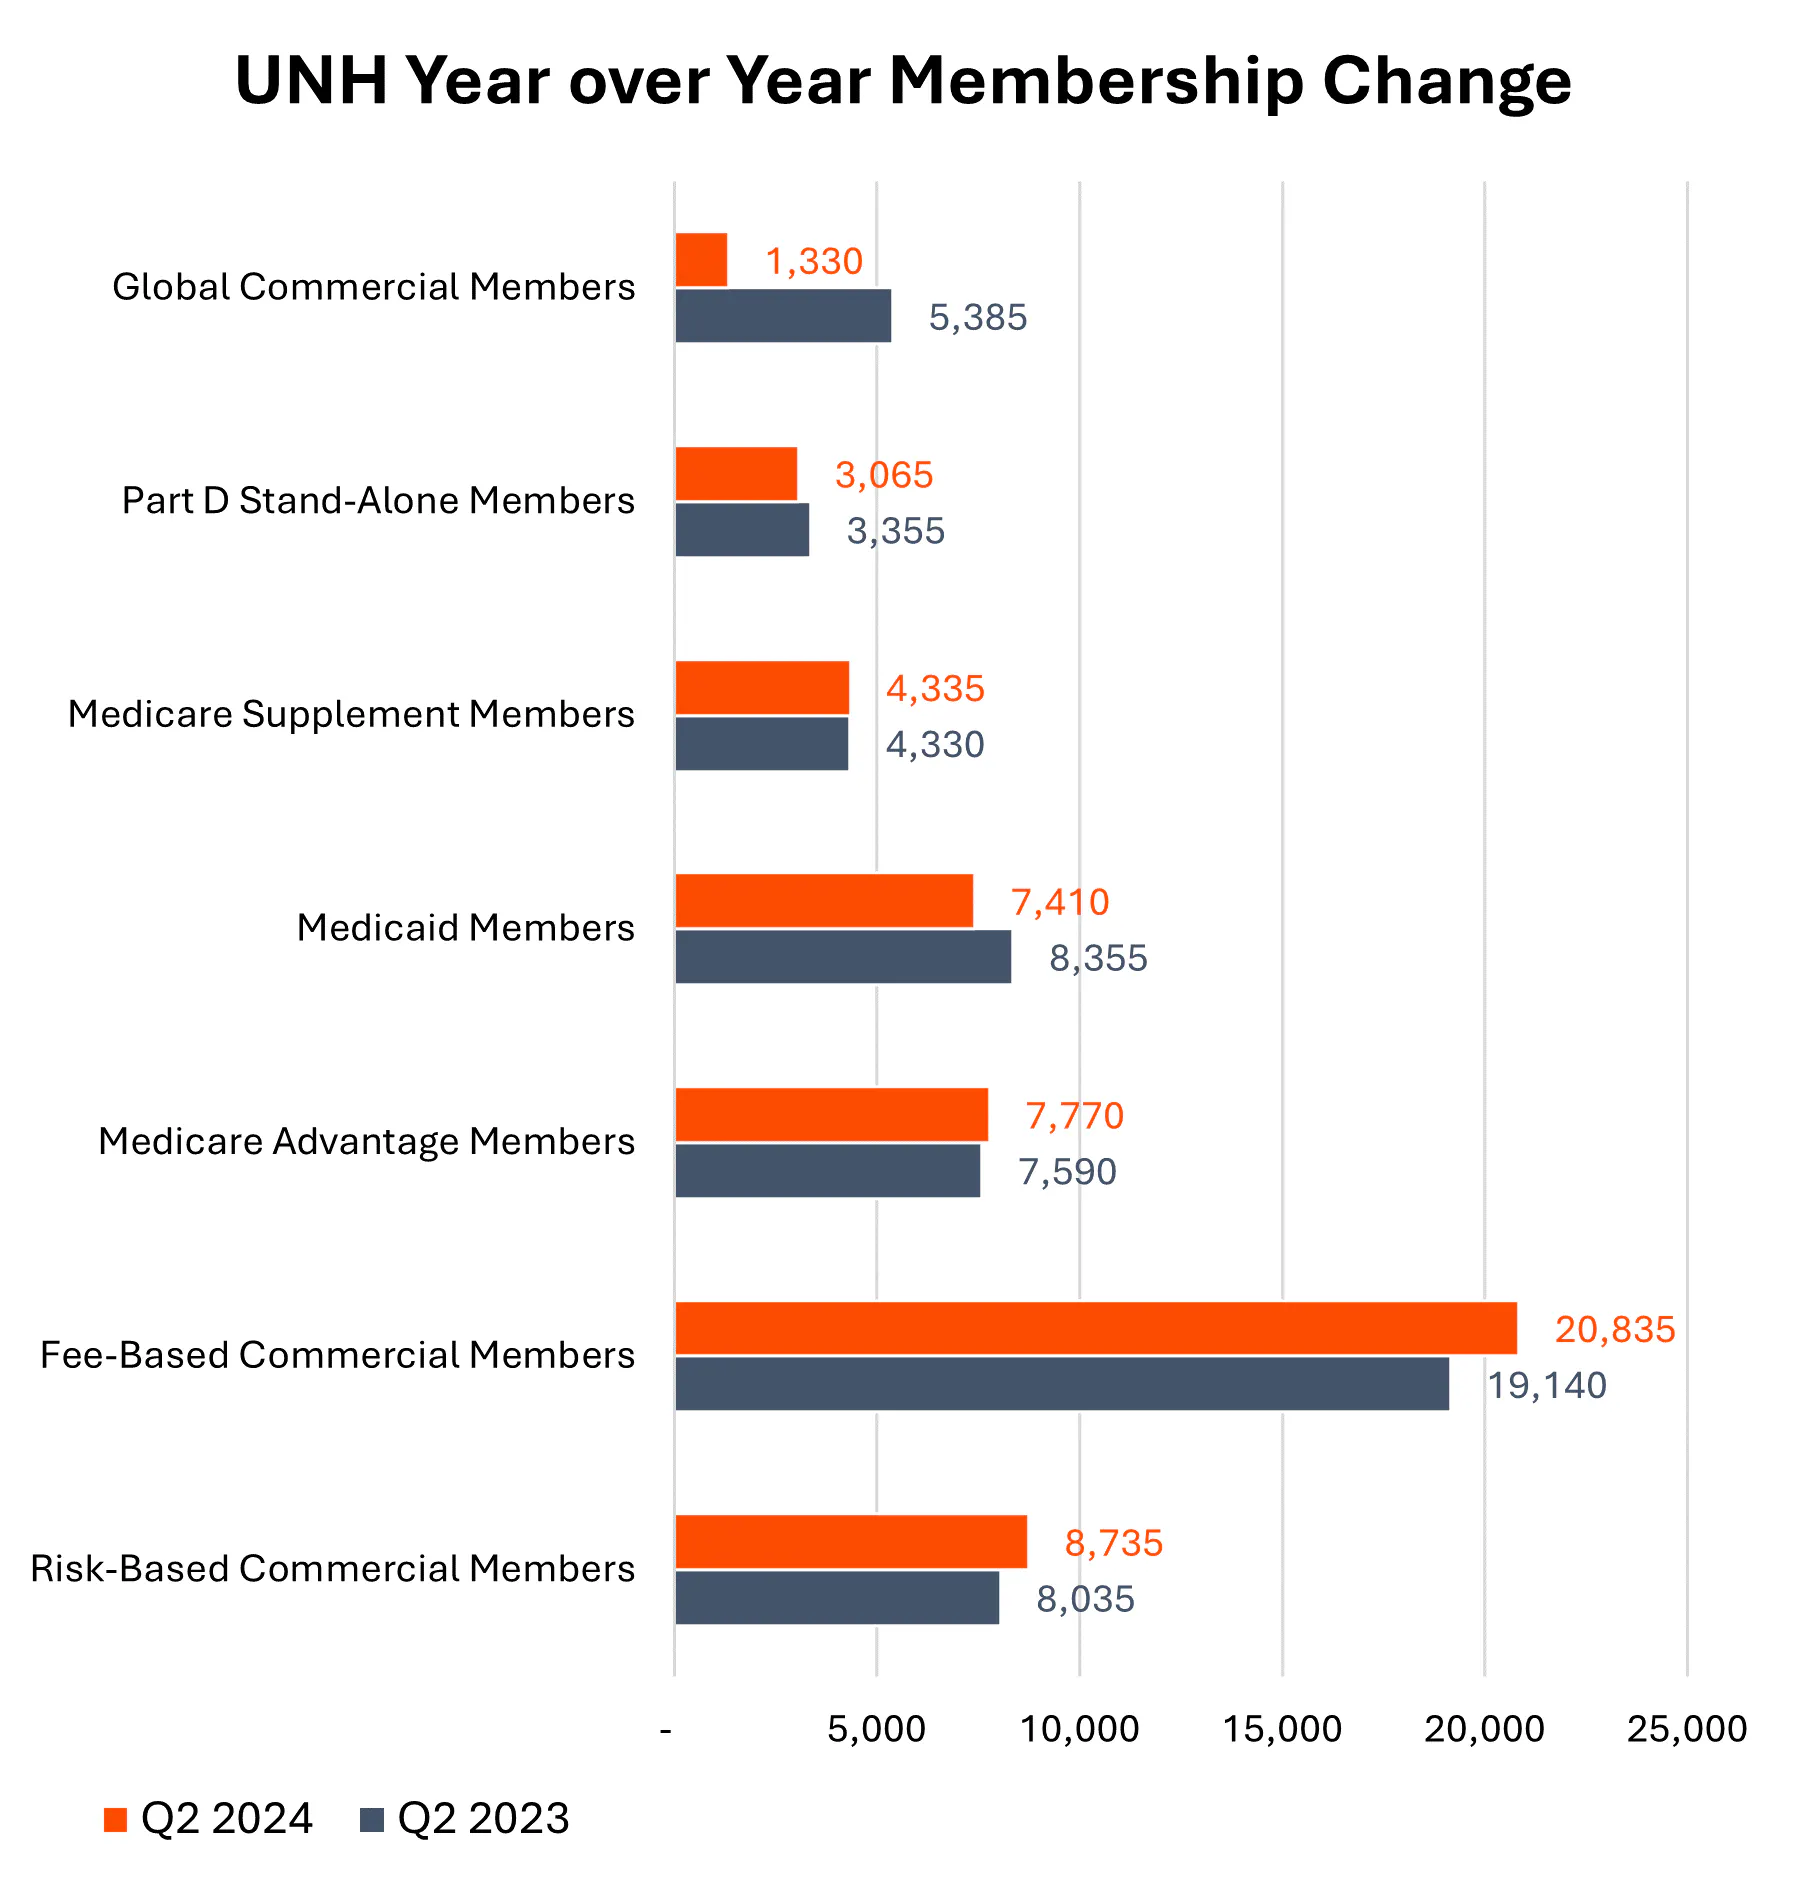
Year-over-Year changes in Membership (as 2025 MA bids get ready to go):

That's it for this edition! Thanks for reading...er...looking?

For exclusive content, access to the data and visuals behind the scenes, and thoughtful conversations / networking around healthcare issues that matter across siloes, join my Board Room community!

MISCELLANEOUS MADDENINGS

Let's go JT! Bring it home!

Thanks for the read! Let me know what you thought by replying back to this email.


— Blake  

Get Hospitalogy in your inbox

The weekly read for the people running the business side of care delivery.

Written by Blake Madden

By Blake Madden

Hospitalogy

The weekly read for the people running the business side of care delivery.