
Join my Hospitalogy Membership! If you’re a VP or Director working in strategy or corporate development at a hospital, health system or provider organization, you will get a lot of value out of my community as I purpose-build the content, fireside chats, and conversations for this group. Join for free today.
Hospitalogists,
Today I’ll be sharing a couple visuals for you guys that I put together around for-profit and nonprofit health system performance for the top 50 health systems by operating margin including a comparative analysis of those names across revenue growth and operating margin performance.
Let’s take a quick dive, and let me know your thoughts. Also, it took me a decent chunk of time to put together so I’d really appreciate a share if you find it valuable. You can subscribe to Hospitalogy here. Thanks fam.
Also – do me a favor and register for my upcoming virtual event here!
Blake’s Breakdown: The top health systems by operating margin, and visualizing expansion
The below chart is sorted by total 2024 operating margin (calendar year (CY) ended December 31, 2024 – yes, I went through and added all of the partial half-year or quarter-year periods to those health systems with fiscal years ended in June) . Green bars represent operating margin expansion. Orange bars represent operating margin contraction. The labels represent each health system’s reported CY 2024 operating margin. (PS – if you spot any mistakes, feel free to let me know).
Keep in mind that operating margin is calculated by subtracting all operating expenses from total revenue, so it leaves out non-operating items like marked-to-market investment gains from the massive endowments most of these systems manage.
Since this is a retrospective analysis, Hospitalogists know by now that health systems enjoyed broad-based recovery in 2024. But there are a few notable names that stick out like a sore thumb: Penn Medicine, Memorial Hermann, and Sentara Health. I couldn’t resist but look into why Sentara saw such terrible performance in 2024 and it looks like the hit was almost entirely related to the Medicaid redeterminations process leading to issues on the health plan side. Oof.
By the way – If you’re part of ANY of these health systems and want to shed light on your system’s 2024 performance, I’m all ears!
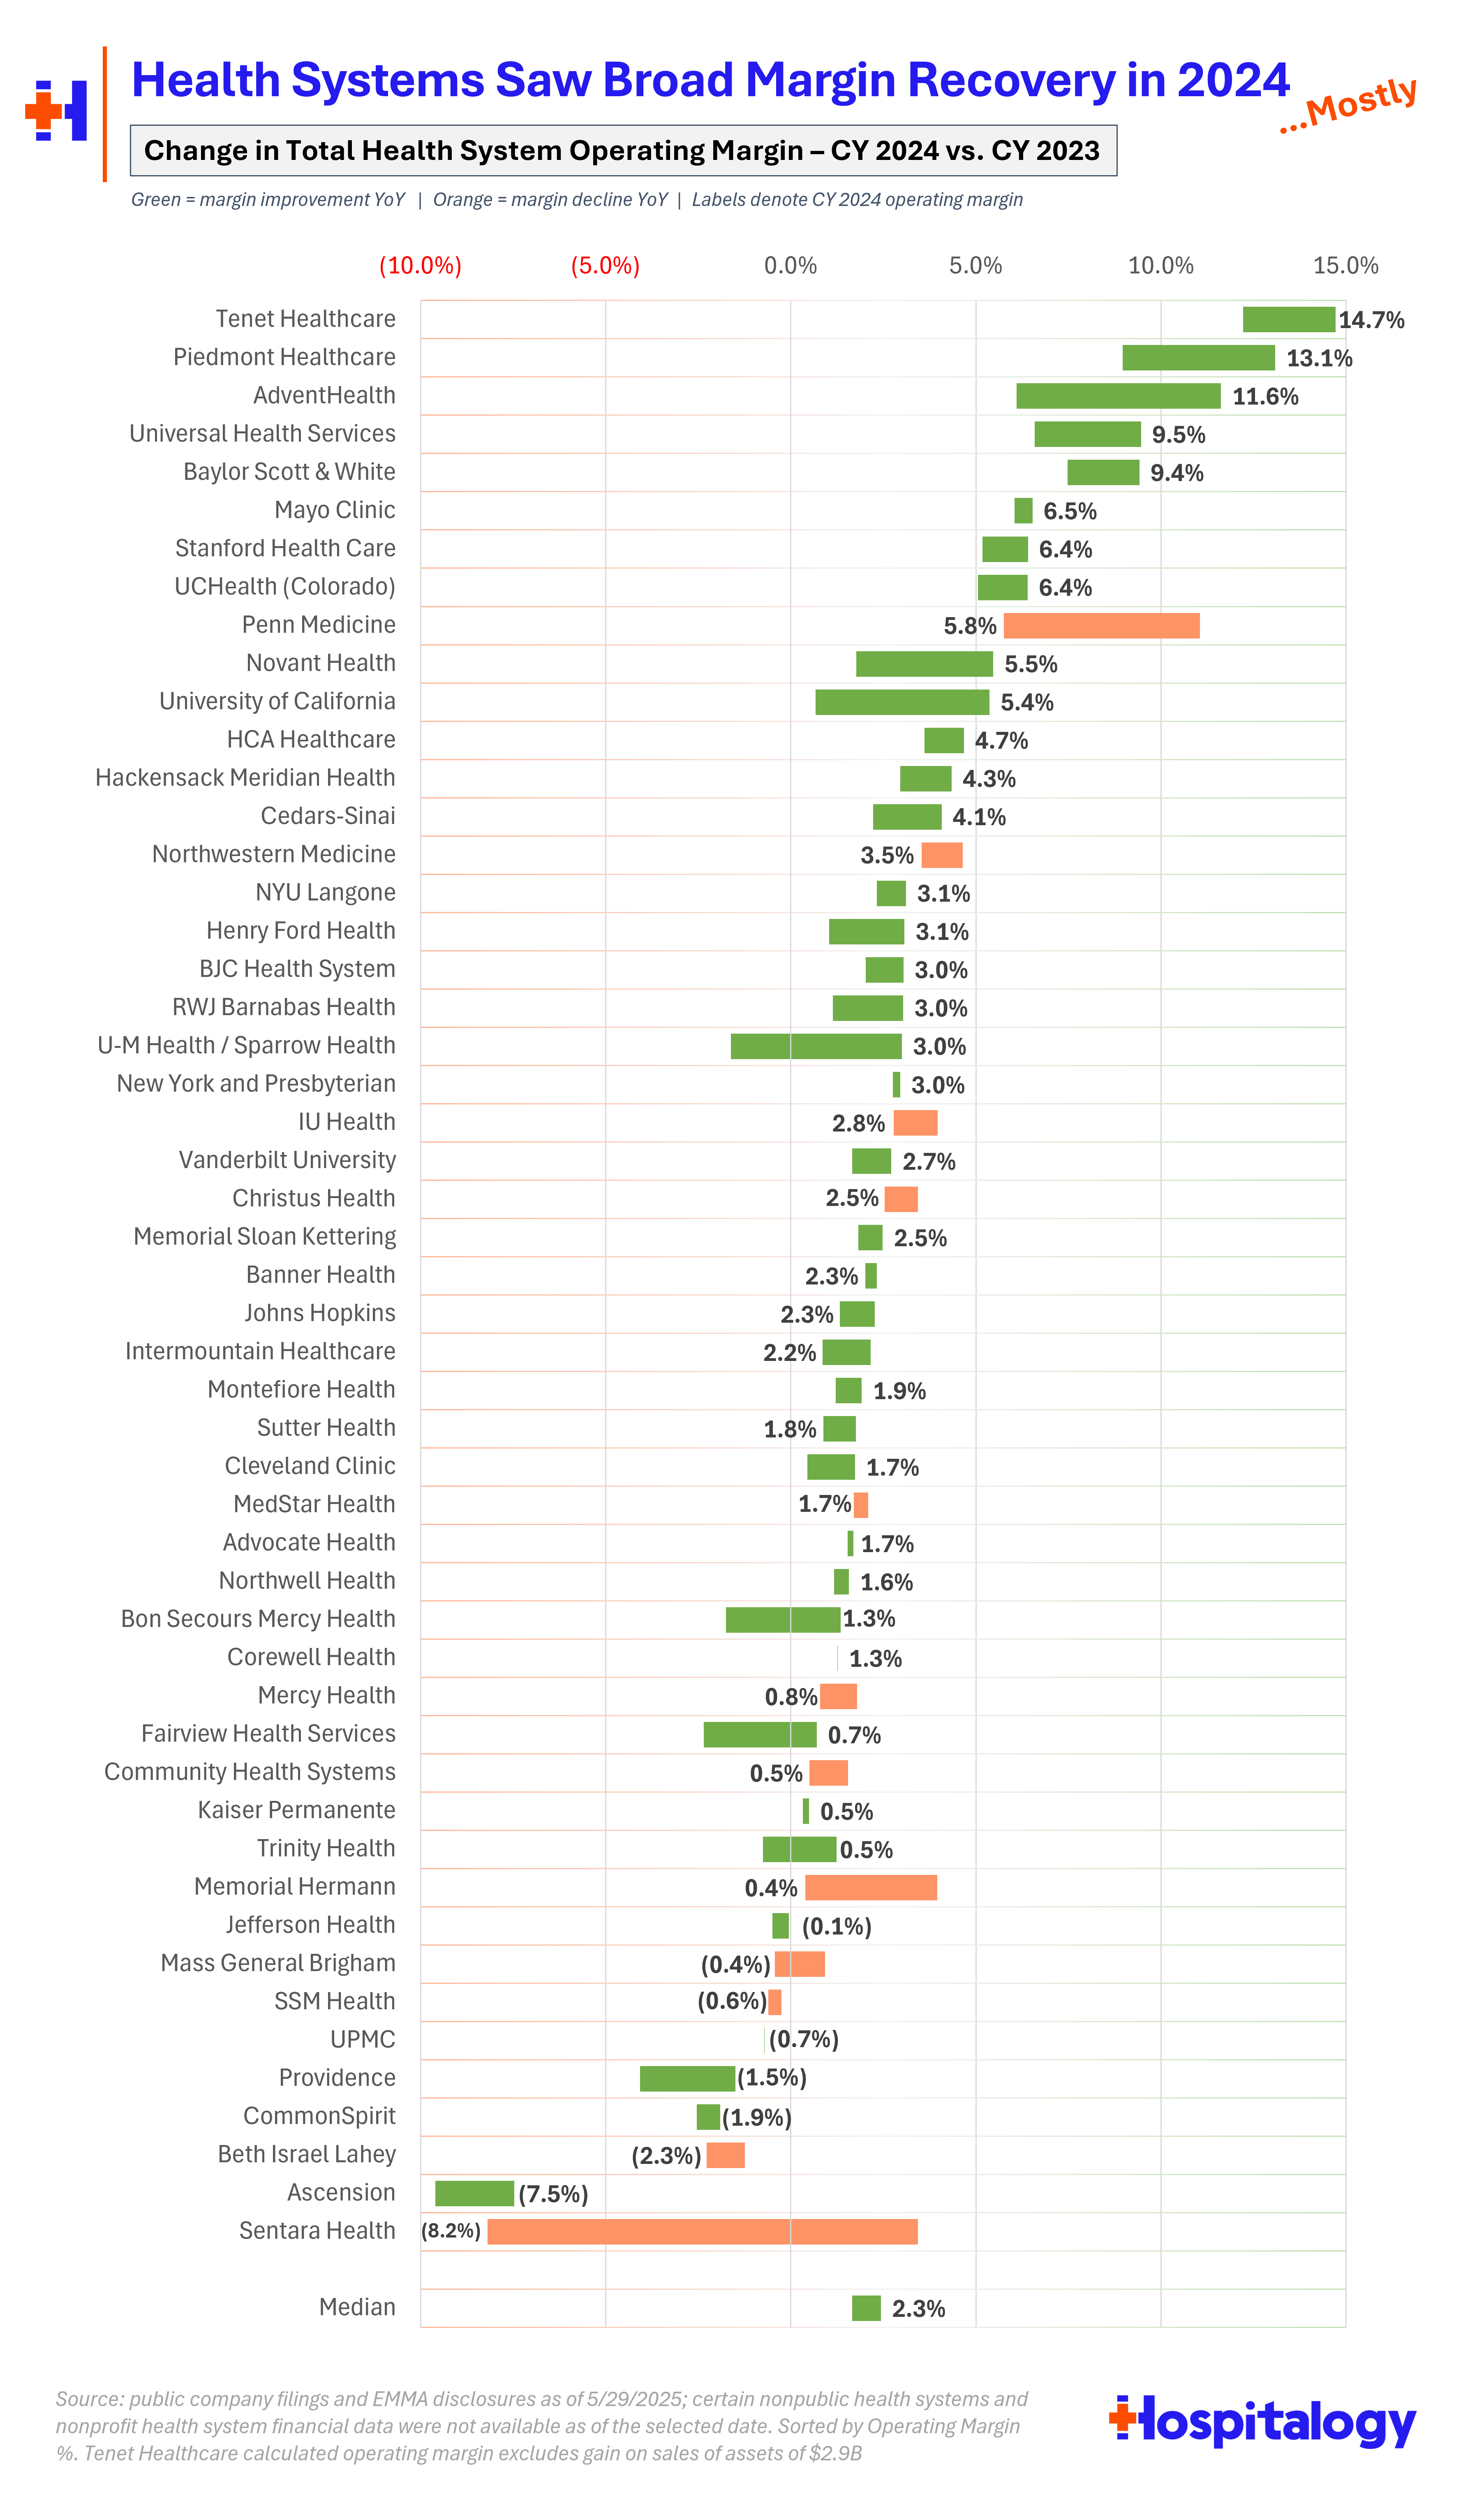
On the positive side of things, we’ve already covered Fairview Health Services’ turnaround and how that came to be (alongside broad macro tailwinds for health systems). But other strong operating margin expanders include Tenet (largest margin given USPI ambulatory outperformance – I’ve normalized out their net gains on sales from their operating margin to get something that more closely resembles actual operating performance), Baylor, Piedmont in Georgia, UHS, and Novant with its recent acquisitions.
Health System Comparative Scatterplot Analysis
Our final slice of the data today is looking at a scatterplot comparing total operating margin to total net revenue growth. The horizontal axis line represents 10.3% annual revenue growth (the median for all health systems analyzed) while the vertical line represents 2.3% operating margin (also the median). As you can see, most names fall near the middle (unfortunately I couldn’t find a clean way to keep Sentara and BJC Healthcare on the grid). Novant stands out to me, as the health system saw major operating margin expansion and revenue growth in what I imagine to be driven by recent M&A and major demographic tailwinds in their markets.
What else sticks out to you?
